


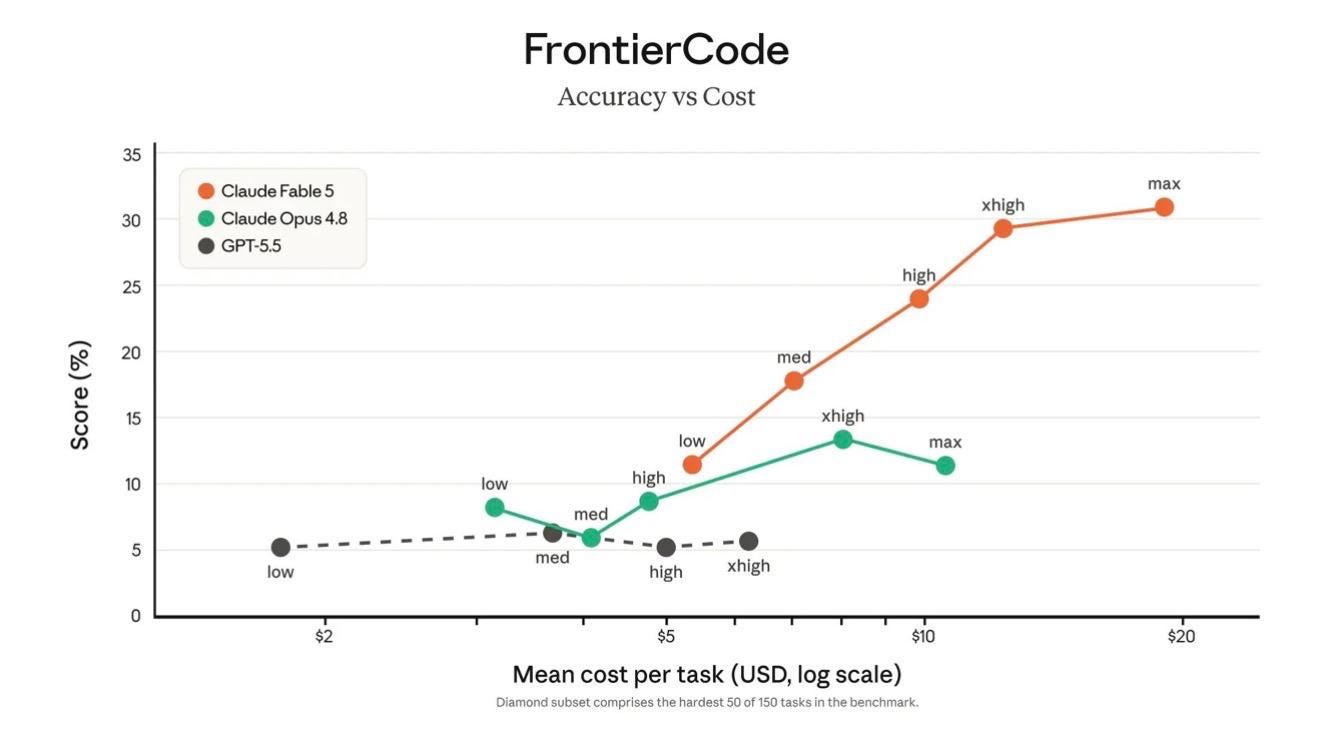
Cognition released a benchmark called FrontierCode last week, and a chart from it has been making the rounds. If you build software with AI the way I do, it’s worth understanding what it measures, because it answers a question most coding benchmarks have been quietly dodging for years. Not “can the model write code that runs,” but “can the model write code a real maintainer would actually merge.”
That distinction is the whole point.
Most benchmarks you’ve seen, SWE-Bench being the famous one, test whether an agent can complete an isolated task and produce functionally correct output. The agent gets a repo and an issue, writes a patch, and we check whether the tests pass. Useful, but incomplete. I’ve watched models pass tests with code I would never let into CognOS. It works in the narrow sense and is a mess in every sense that matters: bloated scope, broken style conventions, fragile in ways that will bite you three months later. Anyone who has spent real time on a large codebase knows that “it passes” and “I’d merge it” are very different bars.
FrontierCode is the first benchmark built specifically to measure that second bar. Cognition worked with more than 20 open-source maintainers across 36 flagship repositories to construct it, and each task reportedly took over 40 hours of expert contribution. The grading looks at behavioral correctness, regression safety, test quality, scope discipline, style, and adherence to the existing codebase’s standards. In other words, it grades the things a senior engineer actually checks in a code review, not just whether the lights turn on.
The chart everyone is sharing uses the Diamond subset, which is the hardest 50 of the 150 tasks. So when you read these numbers, remember you are looking at the brutal end of the difficulty curve. A 30% score on Diamond is not a 30% on “coding in general.” It’s 30% on problems that would make a human maintainer sweat.
What the effort levels mean
The chart plots three models, and each one shows up as a line with multiple points labeled low, med, high, xhigh, and max. Those labels are not different models. They are effort levels, and if you don’t understand them, the chart looks like noise.
Effort is the dial that controls how much internal reasoning budget the model spends before it answers. Low effort means a fast, shallow pass. Max means the model thinks hard, plans, checks its own work, and burns a lot more tokens doing it. The cost on the x-axis, plotted on a log scale, is the mean dollar cost per task. As you turn the effort dial up, the model moves to the right on the chart because it costs more, and ideally it moves up because it scores better.
Ideally. That word is doing some work, and I’ll come back to it.
Reading the chart
Three things jump out.
First, Claude Fable 5 climbs steeply as you raise effort. It goes from around 11.5% at low effort to roughly 31% at max. The effort dial is a real lever here. You spend more, you get meaningfully better code. That is exactly the behavior you want, because it means the dial actually does something.
Second, GPT-5.5 is nearly flat. It sits down around 5 to 6% no matter how hard you tell it to think. The dial barely moves the needle. Whatever is limiting it on these hard tasks is not reasoning budget, so paying for more effort mostly just costs you more.
Third, and this is the strange one, Claude Opus 4.8 does not climb cleanly. It actually dips slightly going from xhigh to max. More effort, marginally worse score. On the hardest tasks, Opus 4.8 seems to hit a ceiling and then waste the extra thinking. That’s a real anomaly, and it’s a good reminder that more effort is not automatically more quality. Sometimes you’re just paying to watch the model talk itself out of a right answer.
The takeaway that actually matters
Here is the part worth internalizing. The most striking thing about this chart is not that Fable 5 wins at max effort. Of course the top of the line wins. The striking thing is where it wins.
Fable 5 at medium effort scores higher than Opus 4.8 at any effort level, including max, and it does it for roughly the same cost or less. Read that again. You do not need to crank Fable 5 to its most expensive setting to beat the competition’s best. Anthropic’s own system card put it plainly: even at medium effort, Fable 5 outperforms every other model at any effort level on this benchmark.
So if you’re trying to figure out how to think about model and effort selection, here’s how I’d frame it.
If the task is easy or routine, none of this matters much. Use a cheaper model at low or medium effort and move on. You will not see the difference, and you’ll waste money chasing it.
If the task is genuinely hard, the kind of frontier work where a wrong patch costs you real debugging time later, this is where Fable 5 earns its premium. The effort dial converts directly into code quality on exactly these tasks. Start at medium, which is already ahead of the field, and only climb to high or xhigh when you can see the quality gain is worth the token cost. Reserve max for the cases where correctness outweighs both cost and latency, and verify it’s actually helping rather than assuming it is.
And don’t port your effort habits between models. The same label does not mean the same thing across models, and as Opus 4.8 shows, max is not always better than xhigh even within a single model.
Here’s a simple way to look at it:
Fable low is almost as good at Opus 4.8 xhigh, but much cheaper.
Fable med is better and cheaper than Opus 4.8 xhigh.
Fable high is much better and a little cheaper than Opus 4.8 max.
One caveat before you treat these numbers as gospel. The scores reflect a specific model-and-harness combination, the grading involves some subjective judgment, and the tasks themselves aren’t public. This is a benchmark, not a law of nature. But it’s a smarter benchmark than most, because it’s finally measuring the thing I actually care about when I’m building something the size of CognOS: not whether the code runs, but whether I’d let it into the codebase.
That’s the question that’s been missing. Nice to finally see someone grade for it.